6 Metrics to Focus on When Using Your Analytics System

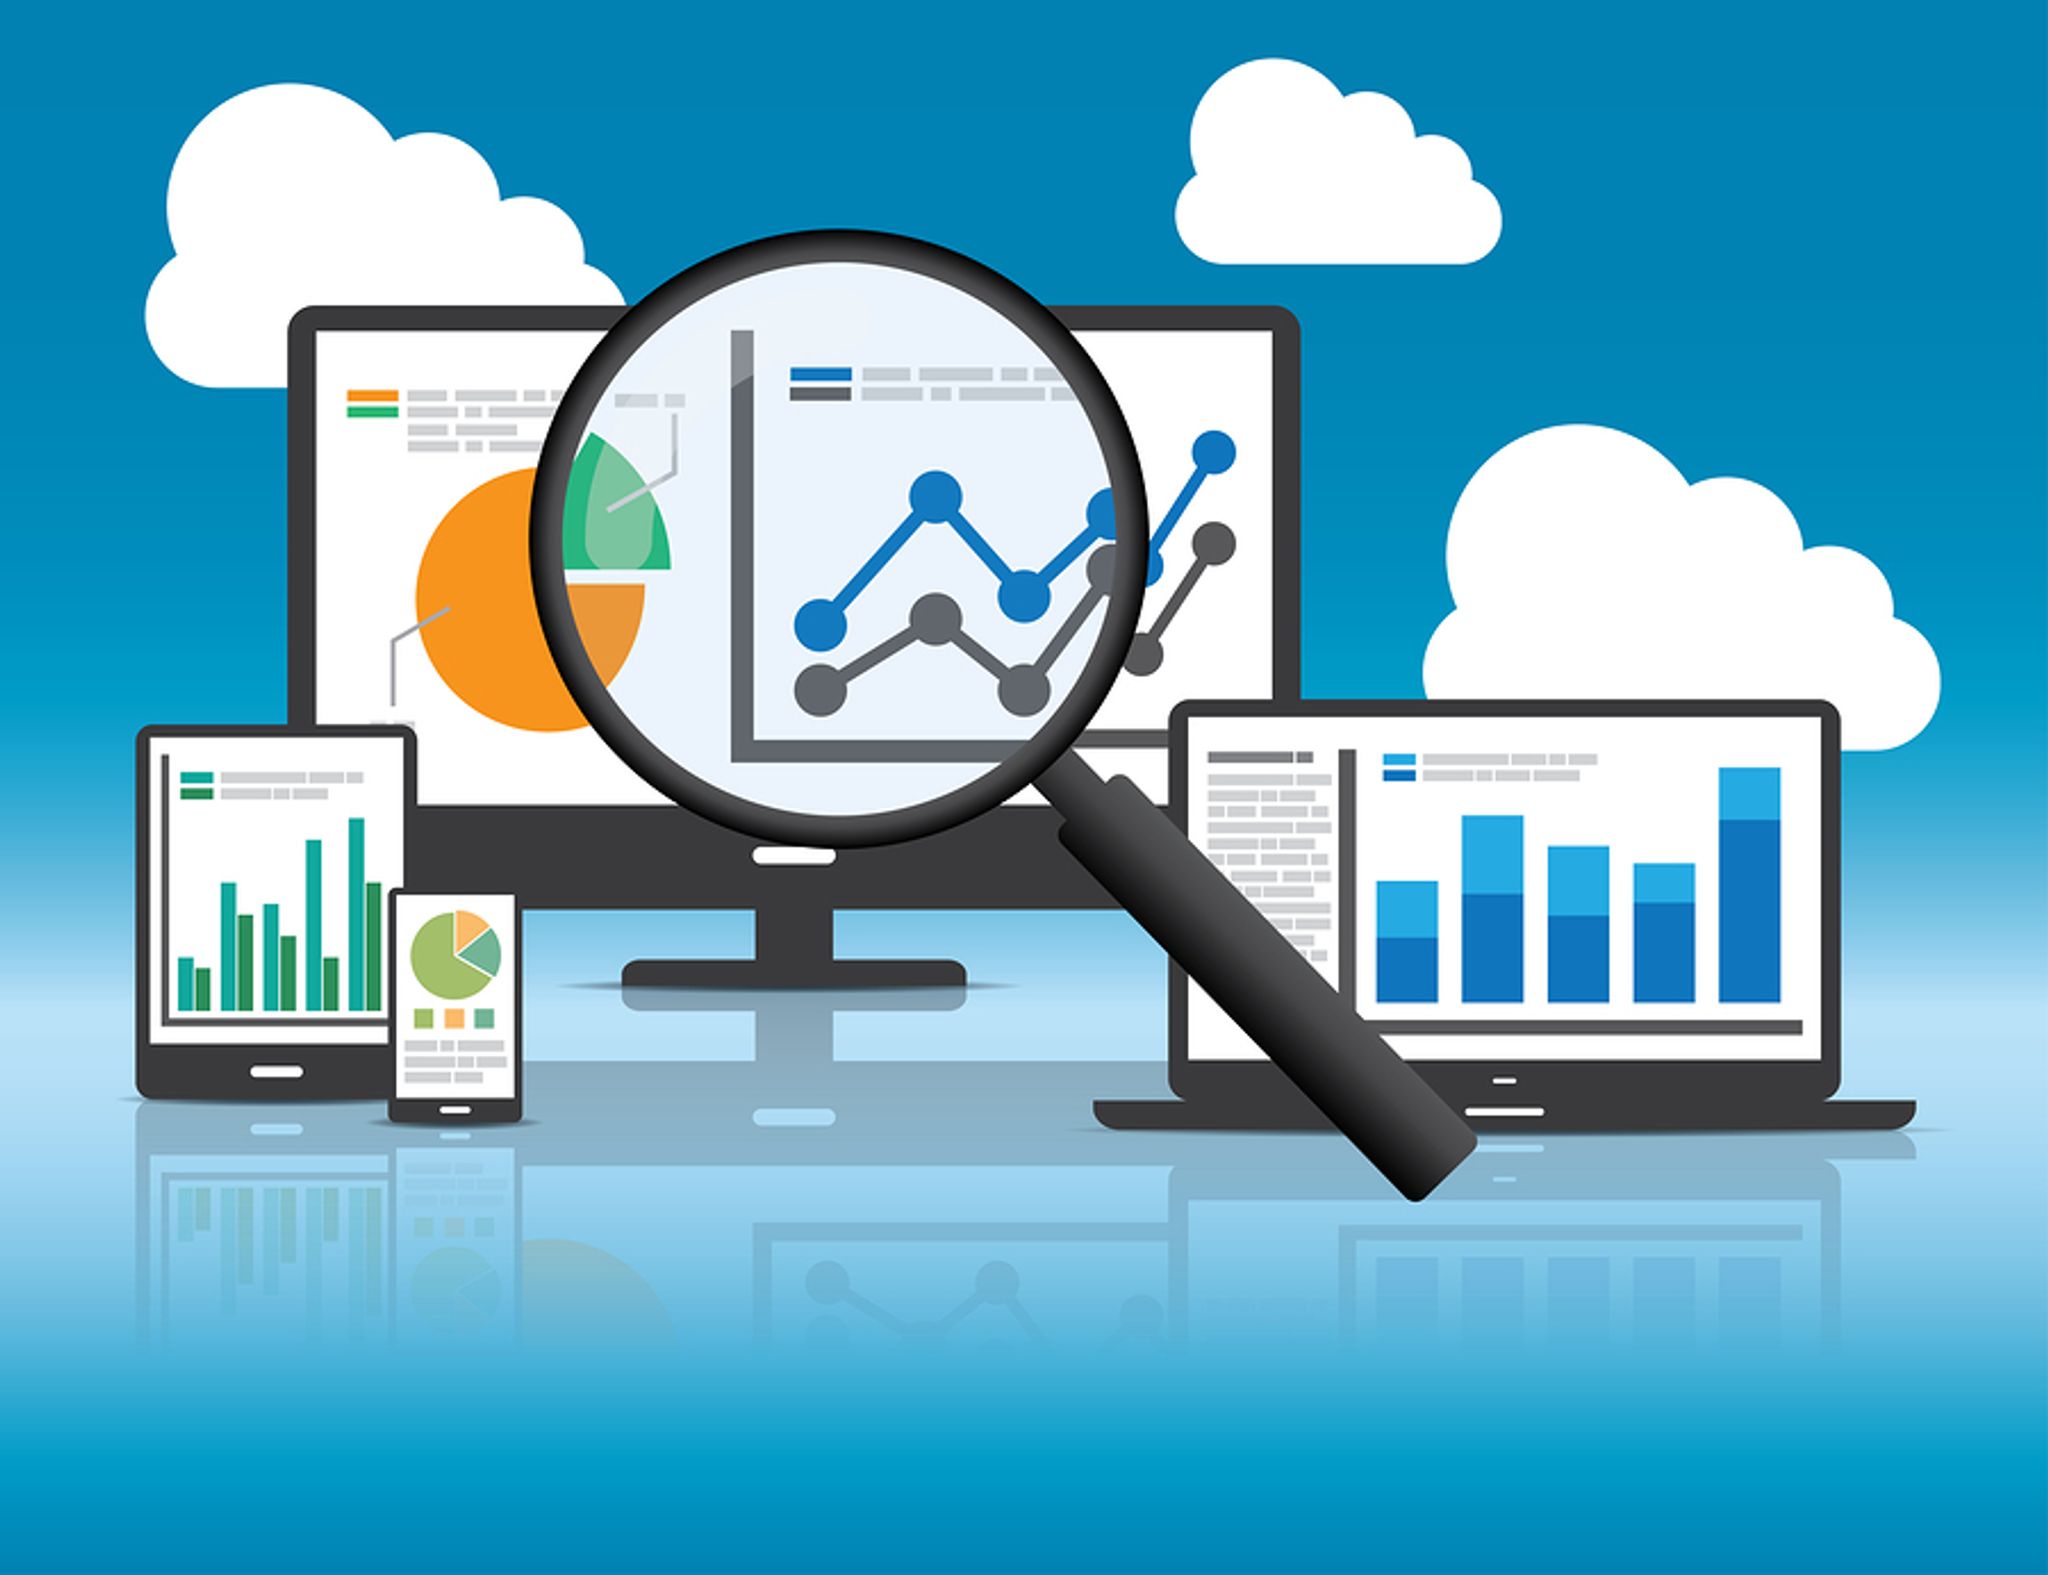
Your analytics platform is your personal website assistant. It will tell you what’s working, what's broken, and in some cases, what your next move should be.
And yet, many businesses fail to utilize their analytics system to its true potential, simply because they don't know how (or where) to read the data that it churns out.
Sure, you know how many visitors your site gets per day, but did you know that you experienced a 25% dip in visits last week? Do you know that only 5% of them got as far as the checkout page in your online store? And if it went in the other direction, and your sales went through the roof due to a promotion, are you recognising the hallmarks of a successful marketing campaign?
With all of the information available, it’s easy to fall into the trap of spending hours on your analytics system without actually learning much at all – and this is how business owners get frustrated.
To be productive with your analytics system, you need to figure out exactly what you’re looking for – before you actually can find it.
Here are a few of the metrics that every business should be looking out for.
1. Pageviews
Your pageviews will indicate the amount of times a visitor has been on a webpage. Every time a page loads up in a browser, it’s counted as a pageview, and this is great for giving you a look at the ‘big picture’ when monitoring your website traffic.
It’s generally a good sign if your pageviews are high, and this metric will help you to identify where to best place/update new content on your site. It’s also a useful metric when deciding on what pages to target with a specific call-to-action. However, if your visitors aren’t spending long on each page, it may mean that your site is difficult to navigate and customers aren’t finding the information they need right away – which is clearly not a good sign at all.
The most important thing to remember, is to measure your page views in context with your other site metrics such as bounce rate. This will give you a more well-rounded overview of your web traffic and enable you to analyze your data more accurately.
2. Landing pages
Tracking your website landing pages is a key part of analyzing the success of your various marketing campaigns.
With a landing page report, you can see exactly what page a customer lands on when they reach your site and the number of impressions each page is receiving. You can also assess the average click-through rate and ranking position.
The most popular landing pages on your site will have a low click-through rate and a high number of impressions, and these are the pages you should focus your attention on.
3. Exit Pages
Marketing isn’t simply about getting customers to visit your site, and it’s actually keeping them there that’s the tougher task.
The exit pages report will reveal how many people leave your site and it will identify the pages that they leave from most often.With this metric, you can find out where your customers are dropping off the radar – and why. Once you’ve got this information, you can figure out how to hold on to them for a while longer.
One key thing to note is that sometimes you want your customer to exit a page – for example, when they make a purchase at the checkout. So it’s not always a bad thing. However, if they are leaving from other pages then it’s something you should investigate further.
4. Bounce rate
A high bounce rate (over 55%) is usually something you want to avoid as it means that a user has left your site after visiting just one page. By keeping an eye on this metric, you can find new ways to retain your site visitors.
However, there are also cases where a high bounce rate is acceptable – such as on the contact form page, checkout, or on individual blog posts. If a page has an unusually high bounce rate, try evaluating the functionality, design and wording of that page to help lower it.
5. Customer Acquisition
Your acquisition overview will show you where your customers are coming from, what they do when they get to your site, and whether they provide a conversion – i.e. by getting in touch, signing up for your newsletter, or making a purchase.
Organic search is normally the top dog when it comes to web traffic, and other avenues include traffic via referral, direct, paid search, and social.
By analyzing where your best converting customers are coming from, you can use this information to better target them in future campaigns.
6. User Behavior
The user behavior metric will give you a visual flow of what people do once they get to your website.
This is important to assess which pages on your site are drawing the most attention and which sections need some extra work. Once you’ve ascertained which pages are the most popular on your site, and why, you can utilize this design in future.
There are many things to consider when reviewing your website analytics and it’s important to keep the bigger picture in mind at all times. Context is everything and once you get it right, your analytics tool will be one of the most important resources that your business has.
What key metrics do you analyze for your business? Let us know in the comments below.