PrestaShop's Love Affair with Statistics

Love is in the air, but there are no poems or love notes being exchanged. Instead, the numbers are doing all the talking.
Ever since the release of version 1.6, PrestaShop has been head over heels in love with statistics. As a result, PrestaShop users have been enjoying some unique stat-based benefits, all from the comfort of their PrestaShop back office (otherwise known as the admin panel).
So far this year, PrestaShop – an eCommerce platform with a buzzing global community – has taken a number of big steps to improve itself, achieving nomination in two categories for the 2014 CMS Awards in the process.
One of those steps was to make statistics an integral part of the PrestaShop experience. Let's explore how.
Real-time Margins
Perhaps the most interesting feature of PrestaShop's statistical relationship, is the real-time profit margin reporting.
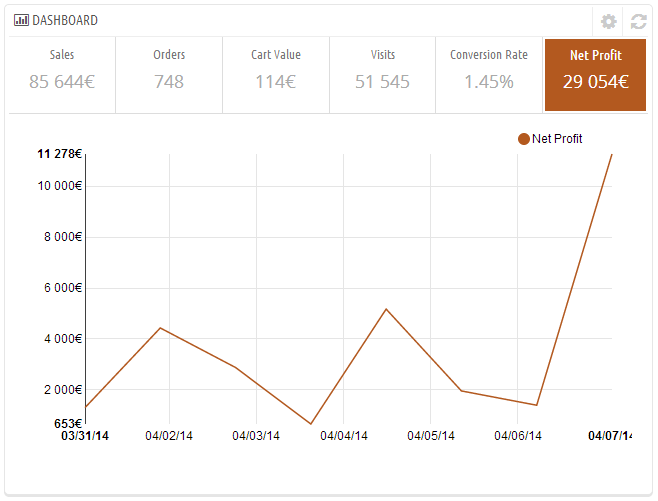
The PrestaShop back office dashboard sports a number of useful graphs, including the “Net Profit” graph, which allows you to keep track of your takings in real time.

Merchants with busy online stores will naturally find this feature extremely useful. In fact, since the profit margins change minute by minute, it could even become an addictive graph to stare at.
Not only is this an immensely powerful feature, it's also completely exclusive to PrestaShop.
And yet, the stats love-in doesn't end there.
Intelligent Merchant KPIs Here, There & Everywhere
Following the release of PrestaShop 1.6 back in July 2014, PrestaShop users have had the pleasure of seeing Intelligent Merchant KPIs (Key Performance Indicators) on numerous pages within their back office.
These indicators are handy, non-obtrusive metrics which appear on pages such as “Orders” and “Customers”, giving relevant stats where-ever they appear.

For example, the Intelligent Merchant KPIs found on the “Orders” page display conversion rates, average order values and net profit per visit over the last 30 days, along with abandoned carts per day.
Meanwhile, the “Customers” page offers up gender and age demographics, as well as average orders per customer and newsletter registrations. All highly relevant information, presented in a simple way.
But still, the numeric romance continues.
Forecasting & Yet More Integrated Stats
Forecasting is another notable PrestaShop reporting feature.
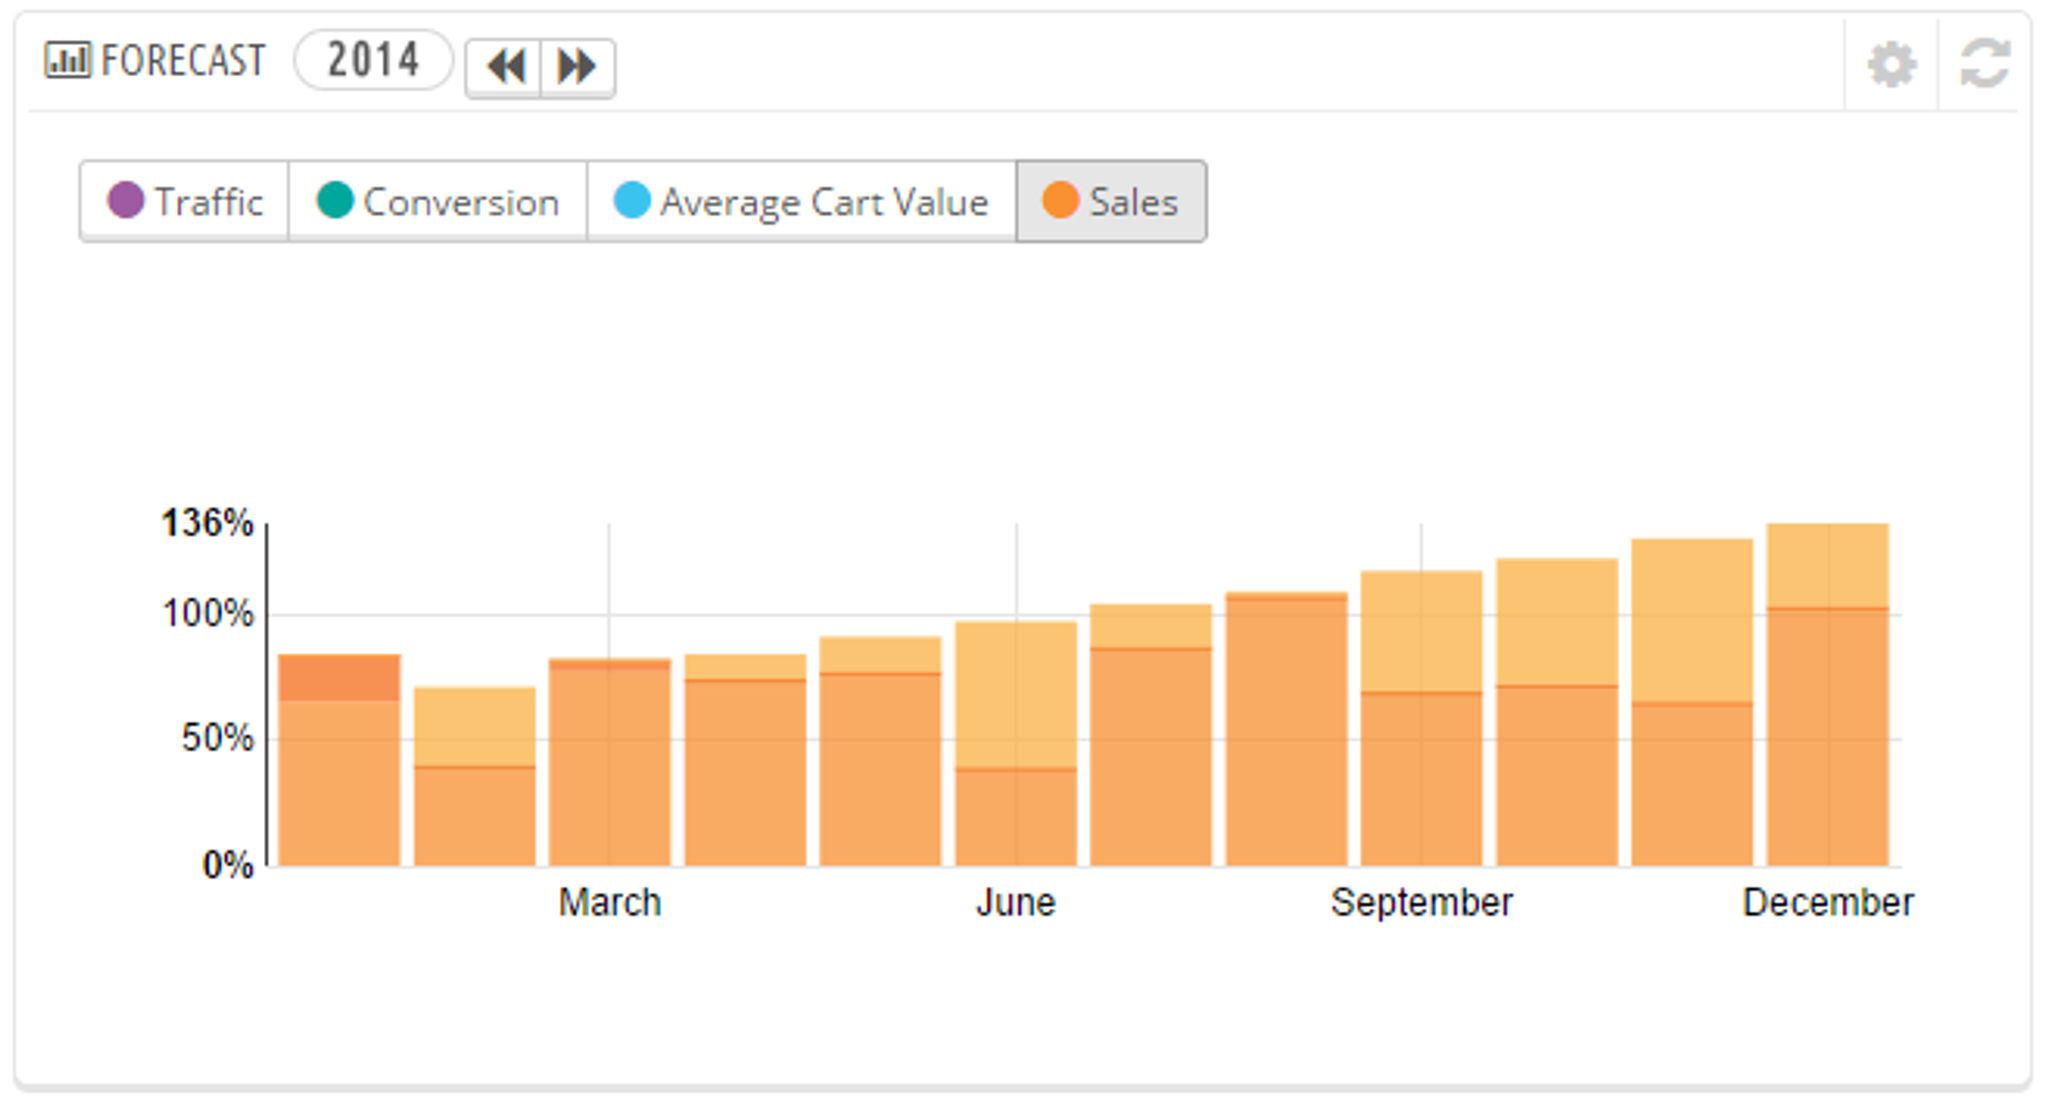
Located on the back office dashboard, the forecasting graph shows merchants their predicted metrics for traffic, conversions, average cart values, and sales. The forecast for each value is based off of current and previously recorded stats.

Further to these powerhouse features, PrestaShop also offers statistics via a dedicated “Stats” page, where merchants can study their best-selling products, most valuable customers, newsletter registrations, and much, much more.
The back office dashboard, home to the real-time profit margin graph and forecasting feature, also hosts a wide range of metrics, including online visitors, active shopping carts, and more. You can even integrate Google Analytics to take things a step further.
So, I think it's safe to say that PrestaShop's relationship with statistics is a strong one.
With real-time features and relevant KPIs scattered around the back office, PrestaShop offers merchants a unique statistical experience that is not only pleasing to look at, but also genuinely helpful in terms of increasing revenue and understanding customers.